 Download the Example Dot Plot (dot-plot.xls)
Horizontal Dot Plot
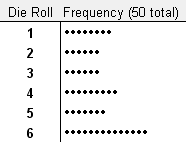
I like board games. The example dot plot below shows the number of times out of 50 that I rolled a 1-6 with a single die. Actually I cheated because these values were randomly generated in Excel (see the example file). But it demonstrates the point.
Fig 1. A Horizontal Dot Plot
Vertical Dot Plot
One of the games I like to play is Settlers of Catan. If you're familiar with this game, you may recognize why I used the following example vertical dot plot.
Fig 2. A Vertical Dot Plot
Spice up the Dot Plot
When you use this approach to create dot plots, you can change the color of the dot chart by just changing the font color. In the example below, I've used conditional formatting in Excel to automatically make the maximum value red.
Fig 3. Using conditional formatting to highlight the Max
Warning: Make sure you use the same characters and fonts for all the dots or you could end up misrepresenting your data by making one set of dots larger, and therefore longer, than the others.


No comments:
Post a Comment